
How to use the Sleeper API
Last year I built ffwrapped fantasy football analytics, an open source website that provides league insights and analysis. This project was made possible by the free, public Sleeper API. If you're curious about accessing detailed information about your leagues, the API offers comprehensive data without requiring authentication. After working with it for over a year and building a full app, I wanted to share how anyone can create a project of their own. For this tutorial, we’re going to make a simple bar chart that shows the total points scored by each league member.
If you want the league recap without building the charts yourself, ffwrapped can analyze supported leagues, including Sleeper, ESPN, and Yahoo, and turn the same kind of data into season storylines.
1. Setup Your Project
For this project, we're only going to need league and roster data but the Sleeper API provides access to much more, including: transactions, users, matchups, player points, and draft data. To get started, I recommend using Vite, a popular build tool. For more detailed instructions, take a look at their getting started guide. I'll show you how to scaffold a simple project.
Run the following commands in your terminal of choice.
# Create a new Vite project with React
npm create vite@latest fantasy-football-app -- --template react

# Navigate to the project directory
cd fantasy-football-app

# Install dependencies
npm install

# Install additional packages we'll need
npm install apexcharts react-apexcharts
For ffwrapped, I used Vue and TypeScript, but any frontend framework will work. For this tutorial, I'll use React because it's the most popular framework and most developers are already familiar with it.
2. Create Your Visualization Component
Create a file called PointsGraph.jsx in the src folder.
To start, we need to import the useState and useEffect hooks from react and then for the bar graph, we’re going to use the apexcharts library. The PointsGraph component accepts leagueId as props which we'll pass in when we update App.jsx. We'll also setup three useState values to handle the data, loading state, and error state.
chartData: Stores the formatted data for the chart. Initially set to null, and updated with the team names and points after fetching the API data.isLoading: Tracks whether the API request is still in progress. Starts as true, and switches to false when the data finishes loading or an error occurs.error: Holds any error message in case the API request fails. If there’s no error, this stays null.
import { useState, useEffect } from "react";
import Chart from "react-apexcharts";

const PointsGraph = ({ leagueId }) => {
  const [chartData, setChartData] = useState(null); // values to pass into the apexchart
  const [isLoading, setIsLoading] = useState(true); // loading state when data is being fetched
  const [error, setError] = useState(null); // error state if there is an error when fetching data

  return <div></div>;
};
To retrieve the data we need from Sleeper, we can use the fetch API and store the responses in variables usersResponse and rostersResponse. Since fetching data is a side effect, we need to use the useEffect hook. We want the component to remount whenever leagueId changes so we can set the dependency array to [leagueId].
useEffect(() => {
  const fetchData = async () => {
    try {
      // Fetch league users and rosters
      const [usersResponse, rostersResponse] = await Promise.all([
        fetch(`https://api.sleeper.app/v1/league/${leagueId}/users`).then(
          (res) => res.json()
        ),
        fetch(`https://api.sleeper.app/v1/league/${leagueId}/rosters`).then(
          (res) => res.json()
        ),
      ]);
    } catch (err) {
      console.error("Error fetching data:", err);
      setError("Failed to load league data");
    } finally {
      setIsLoading(false);
    }
  };
  fetchData();
}, [leagueId]); // run every time leagueId changes
To make things easier, we can take usersResponse and map the user_id from each user and to their display_name. We need the mapping to connect each user’s total points from the rosters response to their user name. This should also be done in the try block to catch any errors.
// Create user map for easy lookup
const userMap = {};
usersResponse.forEach((user) => {
  userMap[user.user_id] = user.display_name;
});
We can then map through rostersResponse and get the data in the format we need. teamData here is an array of objects where each object has a teamName and points value. The array values are then sorted by points, from highest to lowest.
Finally, we can take teamData and use setChartData to update the chartData state. chartData can then be used in chartOptions where we’ll set the configuration for our apexcharts bar graph.
// Format data into [{teamName: '', points: ''}...]
const teamData = rostersResponse.map((roster) => {
  const teamName = userMap[roster.owner_id];
  const points = roster.settings.fpts + roster.settings.fpts_decimal / 100;

  return {
    teamName,
    points,
  };
});
// Sort by points (highest first)
teamData.sort((a, b) => b.points - a.points);

// Prepare data for ApexCharts
setChartData({
  teams: teamData.map((team) => team.teamName),
  points: teamData.map((team) => parseFloat(team.points.toFixed(2))),
});
Outside of the useEffect, we’ll have to configure our chartOptions. Inside of this object, we can use the chartData state we just updated in the previous step. chartData.points will be used for the series data and chartData.teams is needed for the x-axis categories. The remaining options can remain default, but feel free to check out the apexcharts documentation for further customizations.
const chartOptions = {
  chart: {
    type: "bar",
    height: 500,
    toolbar: {
      show: false,
    },
  },
  plotOptions: {
    bar: {
      horizontal: true,
      distributed: true,
      dataLabels: {
        position: "bottom",
      },
    },
  },
  series: [
    {
      name: "Total Points",
      data: chartData.points,
    },
  ],
  xaxis: {
    categories: chartData.teams,
  },
  title: {
    text: "Total Fantasy Points by Team",
    align: "center",
  },
};
Also outside of the useEffect, we can add a simple loading state and error handling.
if (isLoading) return <div>Loading...</div>;
if (error) return <div>{error}</div>;
if (!chartData) return <div>No data available</div>;
Finally, we can return the Chart with the chartOptions we created and then export the whole component.
return (
  <div>
    <Chart
      options={chartOptions}
      series={chartOptions.series}
      type="bar"
      height={500}
    />
  </div>
);

export default PointsGraph;
3. Update App Component
The last step is to import the PointsGraph component we just made in the App.jsx file. Make sure to update LEAGUE_ID with your own league's id. It can be found in the url of the Sleeper homepage https://sleeper.com/leagues/<LEAGUE_ID>.
import PointsGraph from "./PointsGraph";
import "./App.css";

function App() {
  // Replace with your actual league ID
  const LEAGUE_ID = "...";

  return (
    <div className="app">
      <header>
        <h1>Fantasy Football Points Visualization</h1>
      </header>
      <main>
        <PointsGraph leagueId={LEAGUE_ID} />
      </main>
    </div>
  );
}

export default App;
And we're all done! Here's a look at the final product.
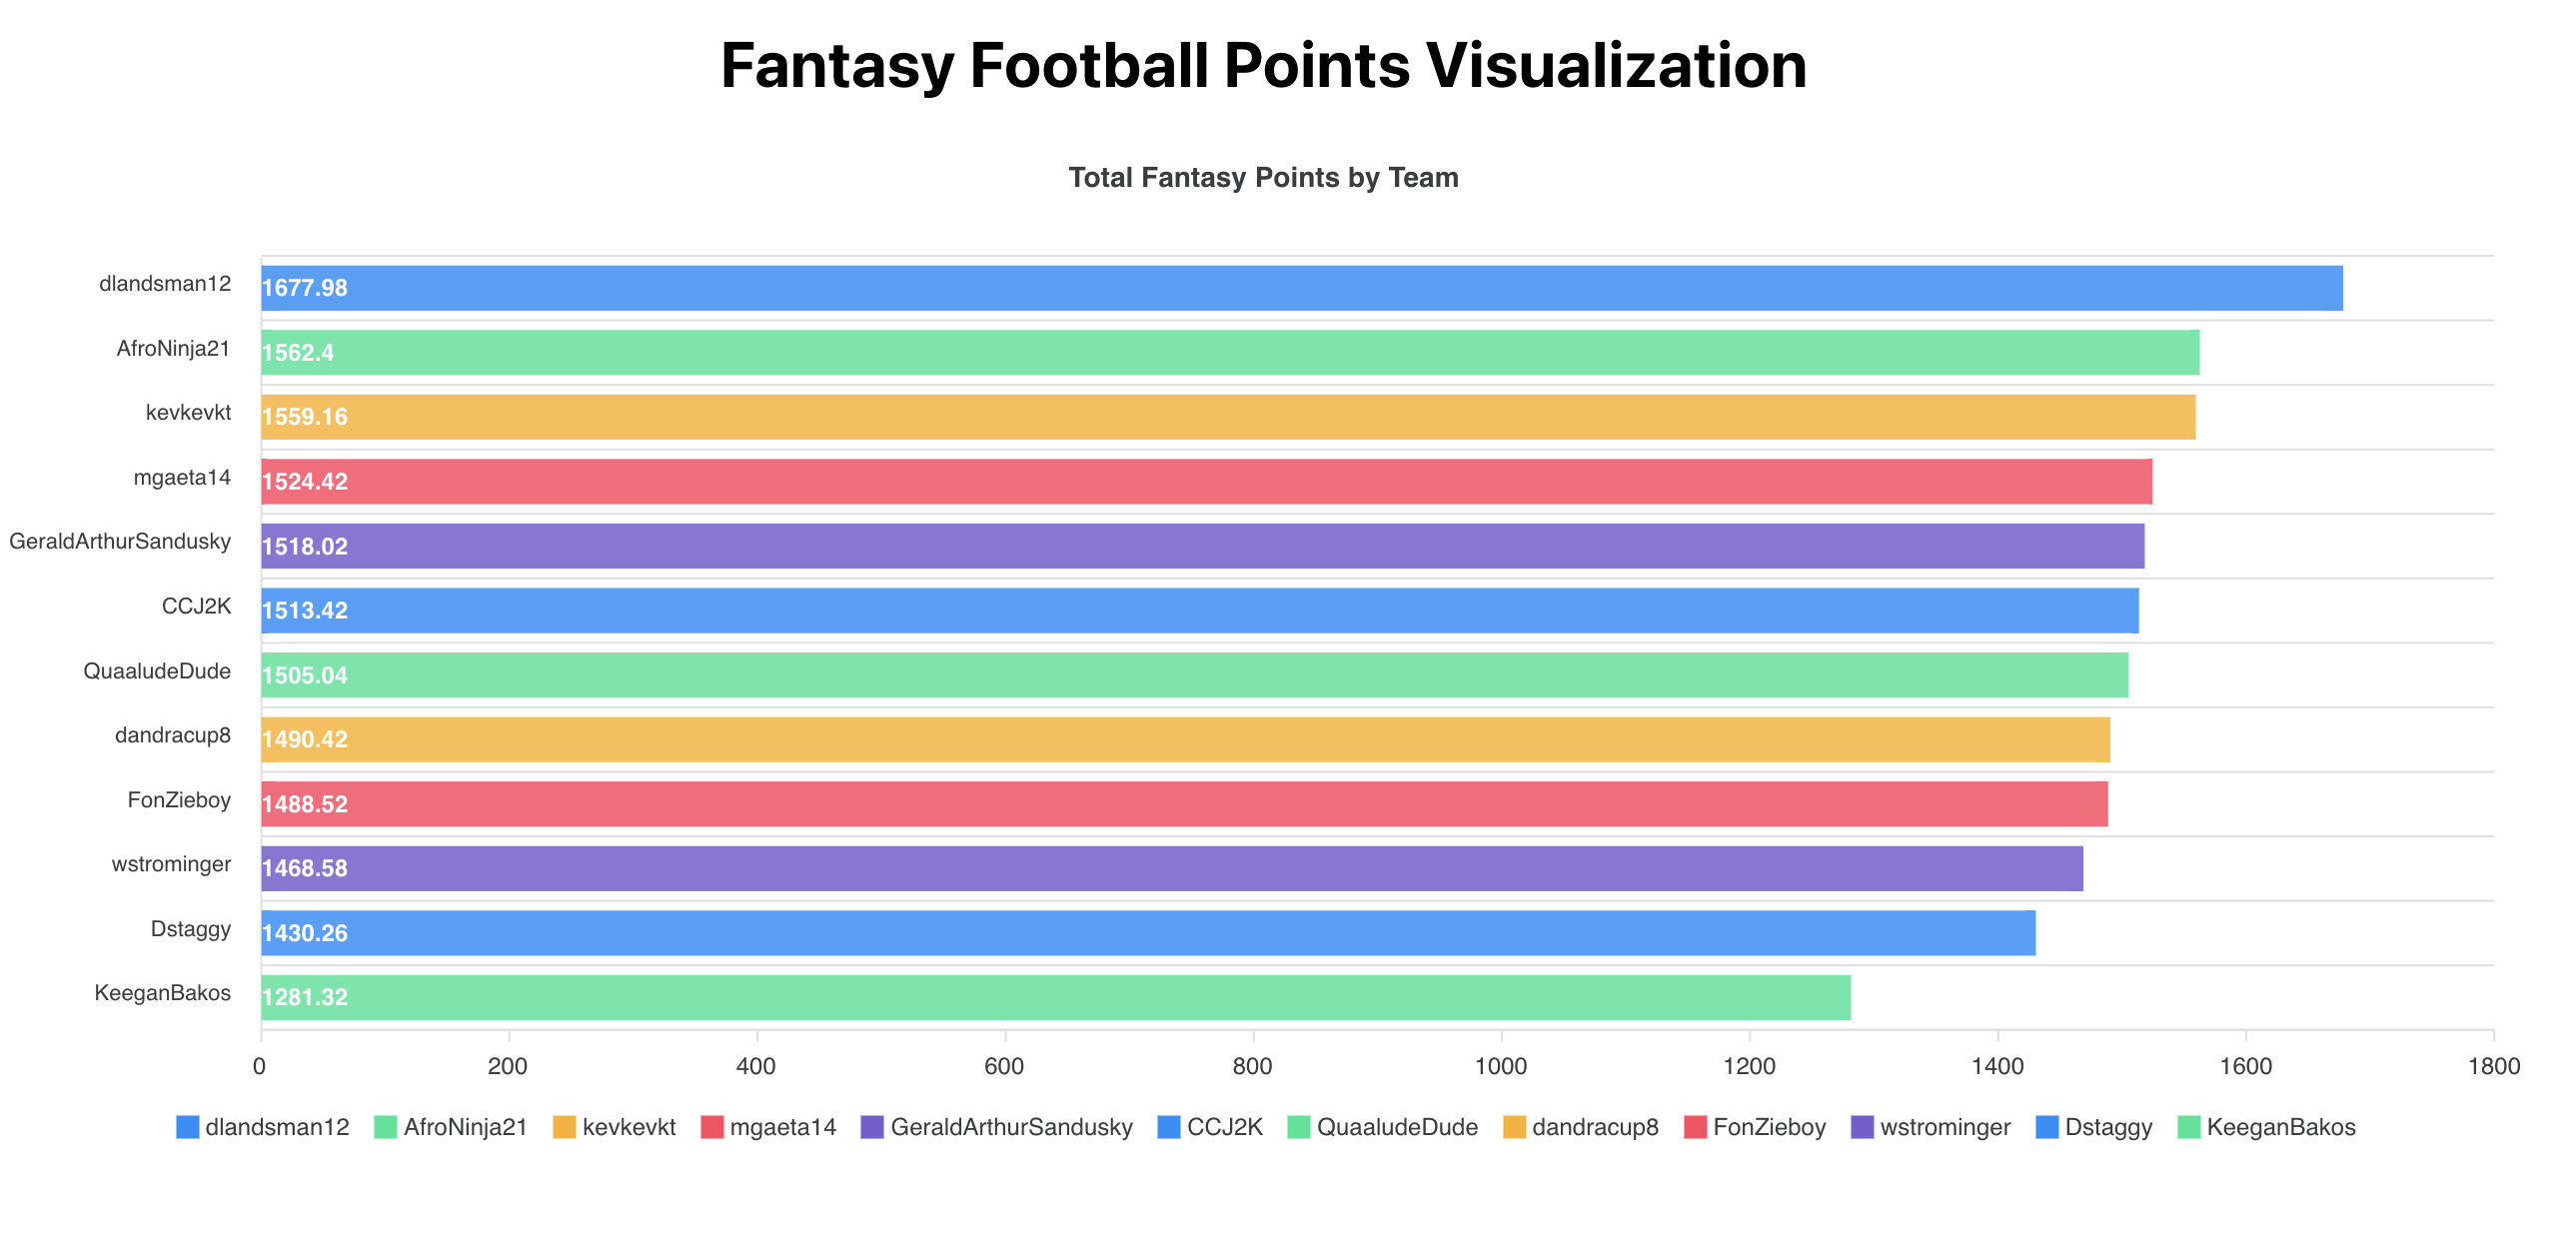
All of the source code can be found on github.
4. Next Steps
Now that you know how to retrieve, manipulate, and display data from the Sleeper API, take a look at the other API endpoints. Some project ideas include a draft board with player grades, charts comparing weekly points scored, and tables with all-time win/loss records. For working examples, explore ffwrapped draft grades, power rankings, and league history.
If you want more league analysis resources, start with the Fantasy Football League Tools and API Guide. For another data-focused article, check out Does draft pick really matter? for a fantasy football analysis built from real league results.